


AI App Store Price Passport 2026: The Same Three-Plan Basket Was 42% Higher in Hungary Than in the US
A 30-storefront audit of public Apple App Store labels found a 42.4% nominal price gap for the same three-plan AI basket. Values use displayed storefront stickers and the August 14 ECB reference rates.
Published: Reading time: 9 min
Table of contents
Result
42.4% higher
The Same Three-Plan Basket Was 42% Higher in Hungary Than in the US
27 markets had a complete comparable basket
Hungary’s ECB-converted three-plan App Store basket was $85.40, versus $59.98 in the US; 27 markets had a complete comparable basket.
Research highlights
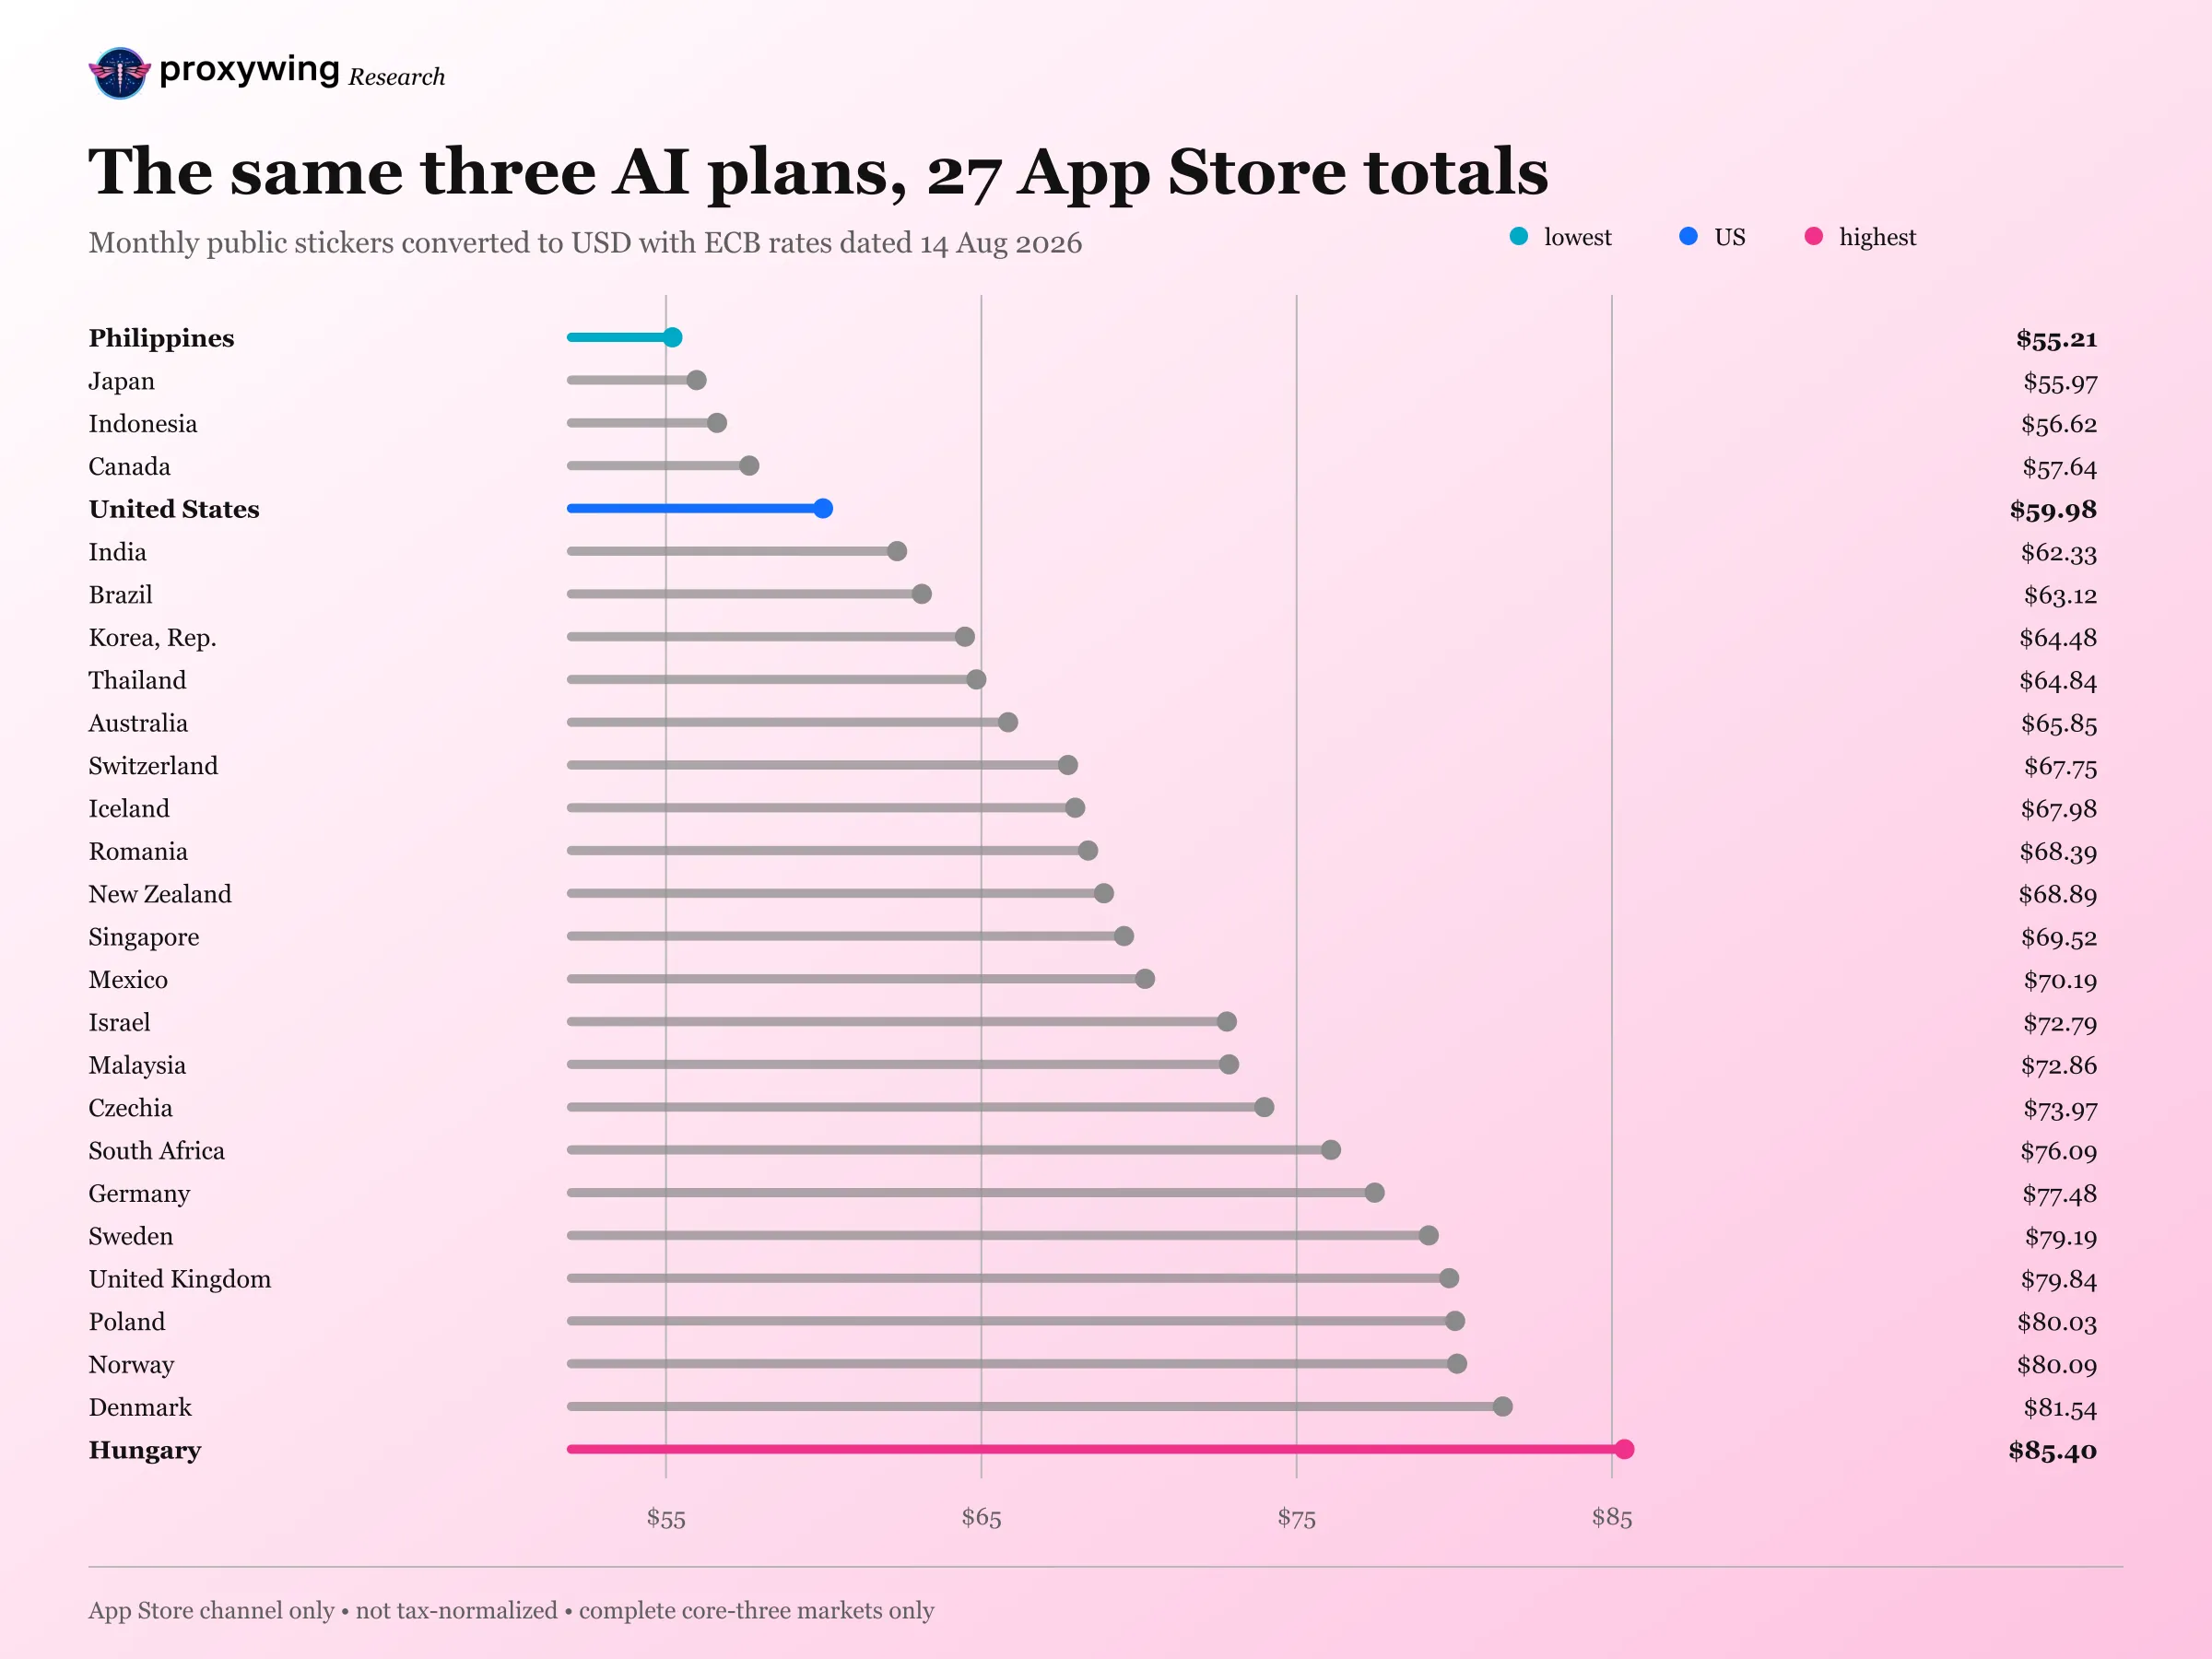
- The complete three-plan basket ranged from $55.21 in the Philippines to $85.40 in Hungary across 27 markets.
- The median basket was $68.89, or 14.9% above the US; 22 of 27 complete baskets were above the US total.
- After excluding both endpoint markets, the remaining 25 baskets still spanned 1.46×.
- Hungary remained the highest basket on all 65 ECB business-day FX snapshots in the sensitivity window.
- The metric uses nominal ECB-converted App Store stickers. Direct-web prices, normalized taxes, promotions and purchasing-power effects form separate comparisons.
The short answer
Across 27 Apple storefronts where all three target labels resolved, the median basket was $68.89, or 14.9% above the US total. The basket ranged from $55.21 in the Philippines to $85.40 in Hungary. Holding the observed local stickers fixed, Hungary remained highest under all 65 daily ECB rate tables tested. These are App Store stickers, not checkout totals.
One basket, 27 different nominal totals
The core comparison holds three product labels constant:
- ChatGPT Plus;
- Claude Pro - Monthly;
- Google AI Pro (5 TB).
Apple's public country storefront pages supplied the displayed local price. We converted each price to nominal US dollars with the European Central Bank's dated reference rates. The US storefront is the comparison baseline.
The basket came to HUF 26,770 in Hungary, equivalent to $85.40 at the snapshot rate. The same three listings totalled $59.98 in the US. That is a 42.4% App Store sticker-price premium after nominal FX conversion.
The lowest complete basket was PHP 3,389 in the Philippines, equivalent to $55.21. The high-to-low spread across the 27 complete storefronts was 1.55×.
The result covers displayed App Store prices. Vendor web quotes, completed-purchase totals, tax composition, Apple pricing mechanics and vendor decisions were outside collection.
Key findings
- We requested 120 official Apple pages: four apps across 30 country storefronts. 114 returned HTTP 200.
- 27 storefronts had resolvable target prices for all three core plans.
- The median three-plan basket was $68.89, or 14.9% above the US. The middle half ran from $63.12 to $77.48.
- 22 of 27 complete baskets were above the US total, including 13 at least 15% higher and six at least 30% higher.
- After removing Hungary and the Philippines, the remaining range is still $55.97 to $81.54, a 1.46× spread.
- In 20 markets, all three core plan stickers were above their corresponding US stickers. In two markets, all three were below.
- Hungary's $25.42 basket gap was split across ChatGPT, Claude and Google at 34.2%, 34.1% and 31.7%. No single plan produced the headline.
- Holding local stickers fixed and substituting all 65 daily ECB rate tables in the archived 90-day file kept Hungary highest every day. The high-to-low ratio stayed between 1.52× and 1.60×.
- Seven exact-name observations were ambiguous because Apple exposed multiple plausible low prices under the same product label. We left them blank instead of choosing one.
- All four sampled China pages and the Hong Kong ChatGPT and Claude pages returned HTTP 404. These are public-page HTTP outcomes and are not treated as evidence of service availability.
The complete storefront comparison
The table includes only markets where all three core target labels resolved. “Vs US” compares each converted three-plan total with the US App Store total of $59.98.
Market | Display currency | Three-plan basket, ECB-converted USD | vs. US |
|---|---|---|---|
Philippines | PHP | $55.21 | -8.0% |
Japan | JPY | $55.97 | -6.7% |
Indonesia | IDR | $56.62 | -5.6% |
Canada | CAD | $57.64 | -3.9% |
United States | USD | $59.98 | 0.0% |
India | INR | $62.33 | +3.9% |
Brazil | BRL | $63.12 | +5.2% |
Korea, Rep. | KRW | $64.48 | +7.5% |
Thailand | THB | $64.84 | +8.1% |
Australia | AUD | $65.85 | +9.8% |
Switzerland | CHF | $67.75 | +13.0% |
Iceland | USD | $67.98 | +13.3% |
Romania | RON | $68.39 | +14.0% |
New Zealand | NZD | $68.89 | +14.9% |
Singapore | SGD | $69.52 | +15.9% |
Mexico | MXN | $70.19 | +17.0% |
Israel | ILS | $72.79 | +21.4% |
Malaysia | MYR | $72.86 | +21.5% |
Czech Republic | CZK | $73.97 | +23.3% |
South Africa | ZAR | $76.09 | +26.9% |
Germany | EUR | $77.48 | +29.2% |
Sweden | SEK | $79.19 | +32.0% |
United Kingdom | GBP | $79.84 | +33.1% |
Poland | PLN | $80.03 | +33.4% |
Norway | NOK | $80.09 | +33.5% |
Denmark | DKK | $81.54 | +35.9% |
Hungary | HUF | $85.40 | +42.4% |
These values use one FX snapshot. Currency movements can change the nominal ordering even when local App Store stickers do not move.
The price gap extends well beyond the two endpoints
The median complete basket was $68.89, which is 14.9% above the US basket. Using Tukey hinges, the middle 50% of markets ran from $63.12 to $77.48, a 22.8% gap from the lower hinge to the upper hinge. This makes the result broader than a Hungary-versus-Philippines comparison.
Position relative to the US basket | Definition Less than $59.98 | Markets | Share of 27 |
|---|---|---|---|
Below US | $59.98 | 4 | 14.8% |
US baseline | $59.98 | 1 | 3.7% |
Above US, under 15% | More than $59.98 and under 15% higher | 9 | 33.3% |
15% to under 30% above US | At least 15% and under 30% higher | 7 | 25.9% |
30% or more above US | At least 30% higher | 6 | 22.2% |
Dropping one market from each endpoint leaves Japan at $55.97 and Denmark at $81.54. The second-highest basket is still 45.7% above the second-lowest. The headline range is therefore larger than the center of the distribution, but it is not an isolated two-country artifact.
Three providers mostly move in the same direction
The balanced comparison contains 81 prices: three plans in each of 27 complete markets. In 20 markets, every plan was above its corresponding US sticker after conversion. All three were below the US in Japan and Indonesia. Four markets were mixed, and the US was the equality baseline.
Pairwise rank correlations show how similarly the providers were ordered across the same markets:
Plan pair | Complete markets | Spearman rank correlation |
|---|---|---|
ChatGPT and Claude | 27 | 0.850 |
ChatGPT and Google AI Pro | 27 | 0.883 |
Claude and Google AI Pro | 27 | 0.764 |
A descriptive two-way decomposition points in the same direction. Of the total squared variation across the 81 converted prices, 87.4% sits in the market component, 0.8% in the average provider component, and 11.8% in the remaining market-by-provider pattern.
This decomposition is descriptive, not causal. All three prices in a market share the same currency conversion factor, which mechanically contributes to their co-movement. The result establishes a strong market-aligned price pattern in this snapshot; it does not identify whether taxes, price points, vendor choices or another mechanism produced it.
Hungary's premium is shared across all three plans
Hungary's basket exceeded the US basket by $25.42. Each provider contributed close to one-third of that difference:
Plan | Hungary, converted USD | US sticker | Hungary minus US | Share of basket gap |
|---|---|---|---|---|
ChatGPT Plus | $28.68 | $19.99 | $8.69 | 34.2% |
Claude Pro - Monthly | $28.68 | $20.00 | $8.68 | 34.1% |
Google AI Pro (5 TB) | $28.04 | $19.99 | $8.05 | 31.7% |
The low endpoint has a different structure. In the Philippines, ChatGPT was $3.72 below its US sticker and Google AI Pro was $2.07 below, while Claude was $1.01 above. Those three differences net to a basket that was $4.77 below the US. A basket total can therefore conceal meaningful provider-level variation even when the country ranking is clear.
Price distributions by AI plan
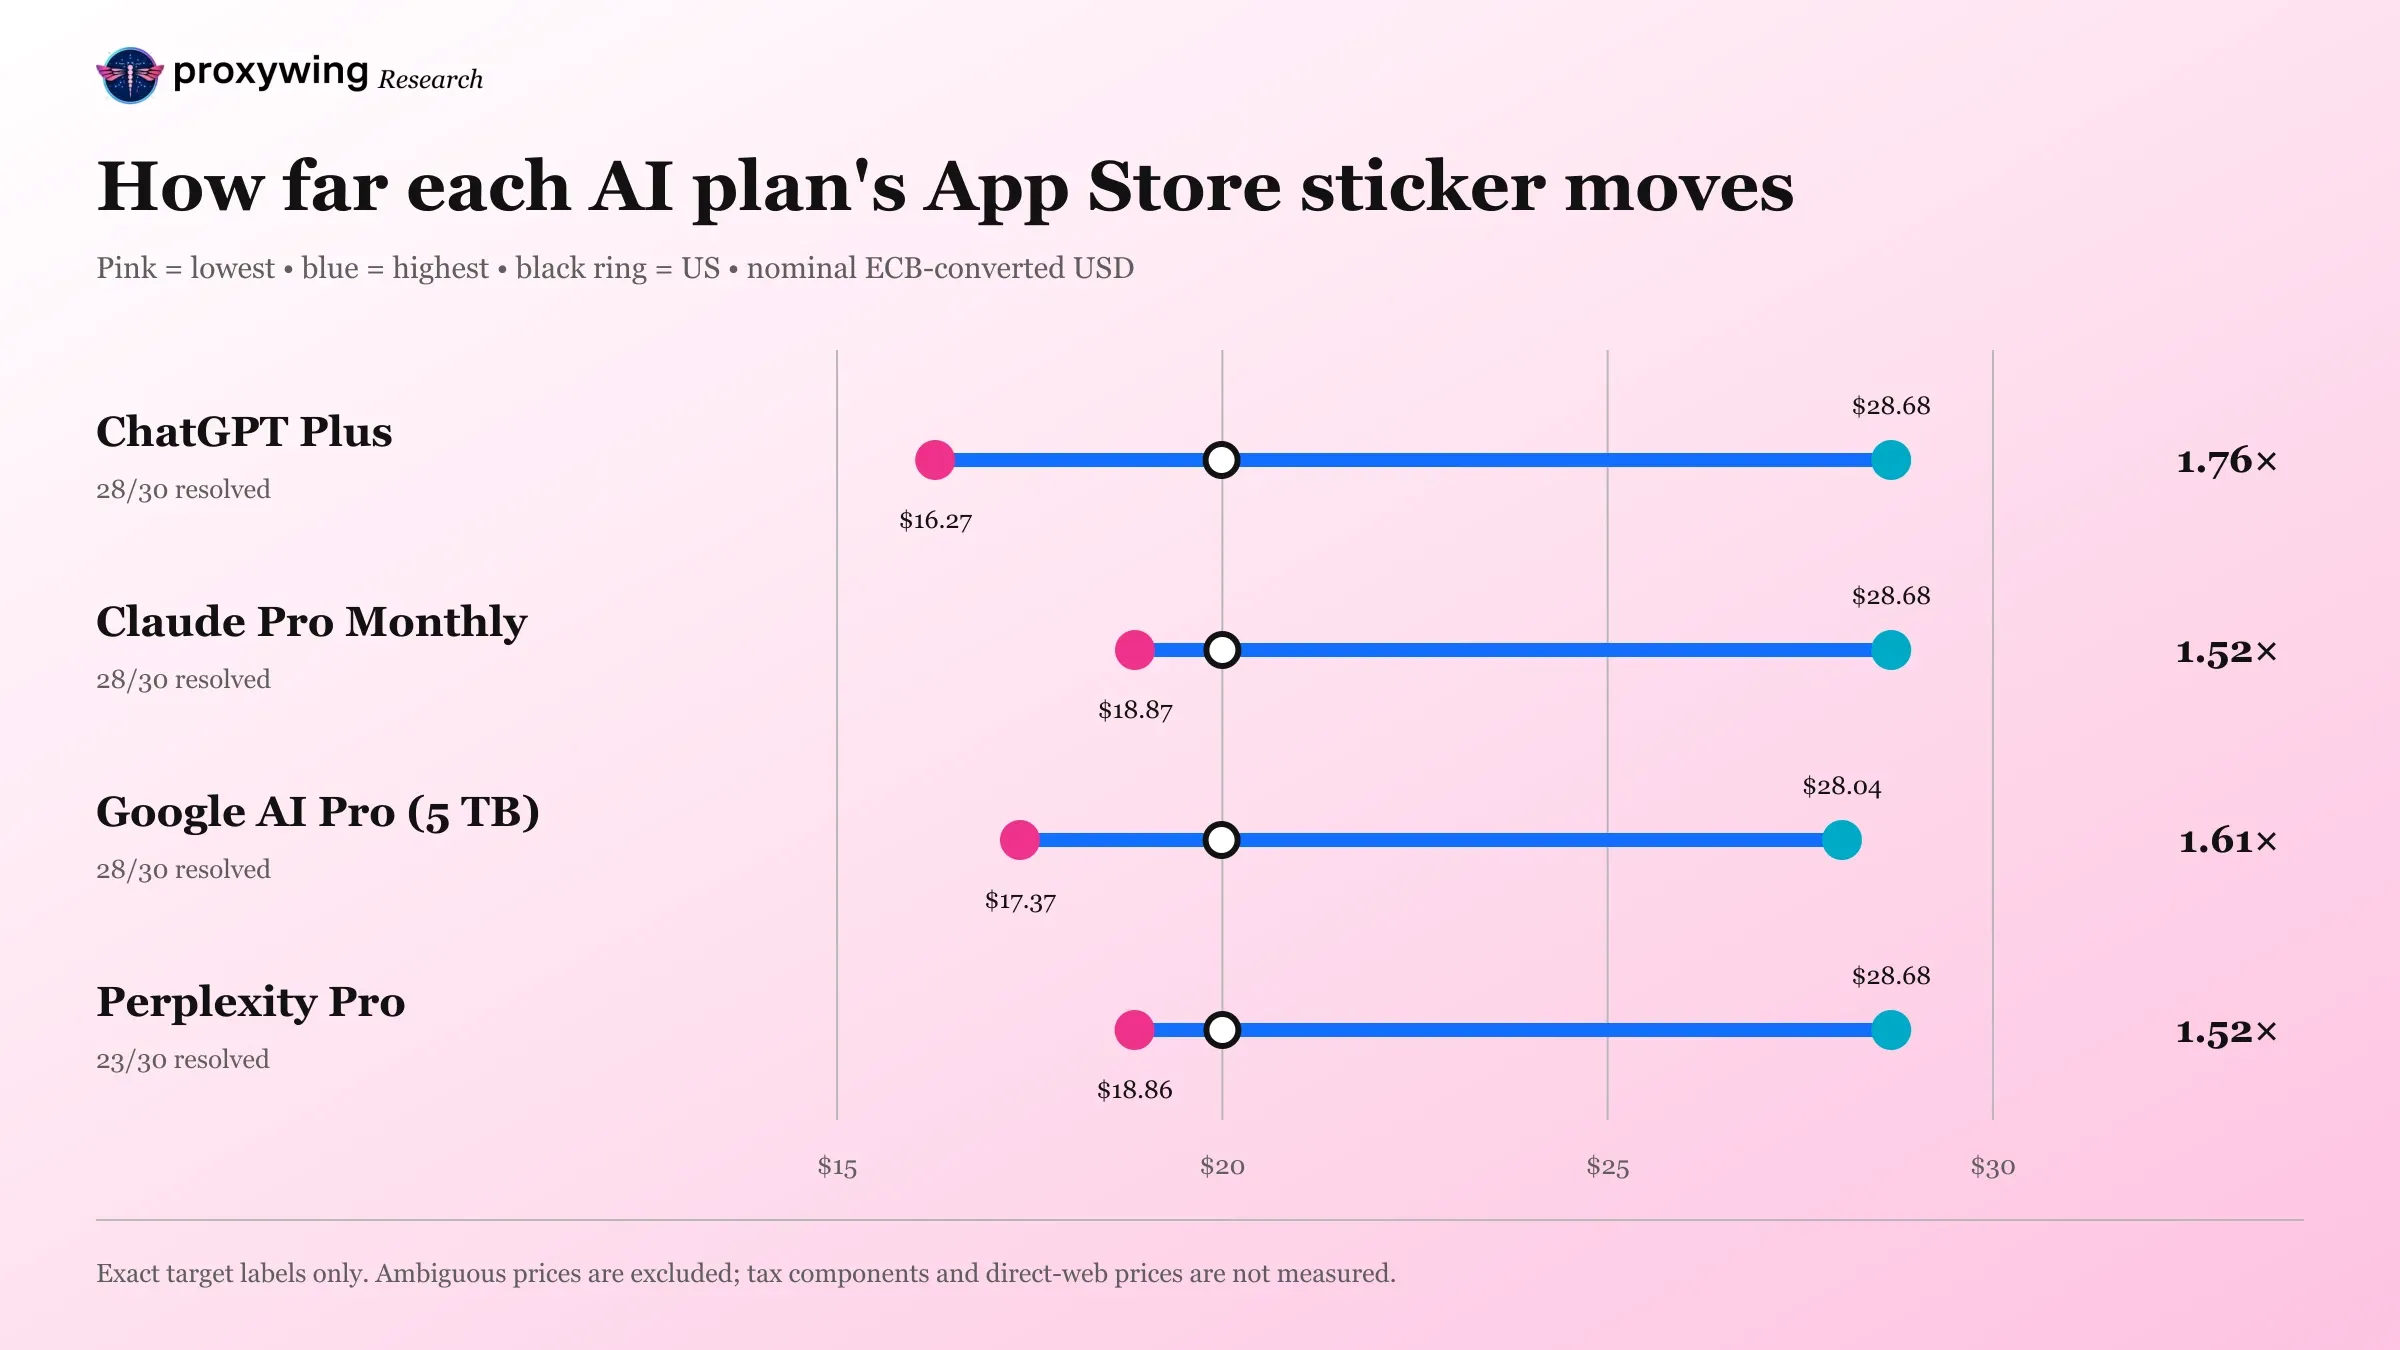
The fourth app, Perplexity, remains in the downloadable provider-level dataset but is not required for the core basket because more storefronts exposed ambiguous exact-name price candidates.
Plan | Resolved | Median USD | Middle 50%, USD | Full range, USD | Above US |
|---|---|---|---|---|---|
ChatGPT Plus | 28/30 | $23.47 | $20.72 to $25.47 | $16.27 to $28.68 | 22/28 |
Claude Pro - Monthly | 28/30 | $23.52 | $21.06 to $25.27 | $18.87 to $28.68 | 25/28 |
Google AI Pro (5 TB) | 28/30 | $22.94 | $20.06 to $25.93 | $17.37 to $28.04 | 21/28 |
Perplexity Pro | 23/30 | $23.70 | $21.10 to $26.19 | $18.86 to $28.68 | 19/23 |
“Resolved” means the public Apple page exposed an exact target label and an unambiguous monthly sticker. Purchase was outside collection.
ChatGPT had the widest endpoint range, but the medians for all four plans sit in a narrow band from $22.94 to $23.70. The market distribution contributes more to the observed variation than differences between the average plan price.
Missing labels change the comparison universe
The three core providers resolved in 84 of 90 market-plan cells, a 93.3% resolution rate. Across all four providers, 107 of 120 cells resolved, or 89.2%. Requiring Perplexity would reduce the complete comparison from 27 to 22 markets because its exact public label resolved in 23 storefronts and did not overlap perfectly with the core panel.
That coverage loss is why the headline basket uses three plans. The choice was set by observable completeness, not by which basket produced the largest spread. All provider-level observations remain in the download, including the blank selections and their reason codes.
Why can App Store prices differ?
Displayed stickers differ across the sampled storefronts. Potential contributors include:
- local indirect taxes included in a displayed consumer price;
- Apple storefront price points and currency conventions;
- vendor-set regional prices;
- exchange-rate movements after a local price was last updated;
- channel-specific commercial terms;
- legacy and current in-app products sharing a public label.
The measured result is a nominal storefront sticker-price gap. Causal decomposition would require tax metadata, product IDs, vendor price histories and transaction-level evidence.
The ranking survives a 90-day FX sensitivity test
The published comparison uses the ECB rate table dated August 14, 2026. To test whether that date created the result, we held every observed local sticker fixed and recalculated all 27 baskets with each of the 65 business-day tables in the ECB's archived 90-day reference-rate file, spanning May 18 through August 14, 2026.
Robustness check | Published snapshot | Across all 65 rate dates |
|---|---|---|
Highest basket | Hungary | Hungary on 65 of 65 days |
Lowest basket | Philippines | Japan on 33 days; Philippines on 32 |
Hungary versus US | +42.4% | +39.5% to +48.0% |
High-to-low basket ratio | 1.55× | 1.52× to 1.60× |
Rank agreement with published order | 1.000 | Minimum Spearman correlation: 0.979 |
Twenty-six of 27 markets stayed on the same side of the US basket under every tested rate table. Korea was the only market to cross the US baseline, ranging from 2.6% below to 7.5% above as the conversion date changed.
This test is not a historical price series. It asks what the same August 15 local stickers would look like under recent official FX tables. It demonstrates that the headline high market, the overall spread and nearly all above-or-below-US classifications are not artifacts of one unusually favorable conversion day.
Storefront prices and affordability measure different layers
The companion Global AI Affordability Index holds a common $20 headline USD price constant across 181 economies and asks how the income denominator changes. This App Store Price Passport does the reverse: it observes local storefront prices for a smaller market panel and shows that the numerator changes too.
Both effects can matter. For example, the observed three-plan App Store basket represents 13.66% of the Philippines' monthly Atlas-method GNI-per-capita proxy and 4.30% of Hungary's. Those ratios are economy-level income proxies.
Extending the comparison to direct-web prices
Apple exposes country storefronts through public URLs, enabling consistent channel-level collection. Direct vendor pricing is a separate measurement layer because pages and checkout totals can vary by location, account country, locale, payment address, cookies and tax jurisdiction. ProxyWing supports matched public-page observations through stable, documented exit locations, with access boundaries and rate limits respected.
How we measured the prices
For every configured storefront and app, the collector requested a URL of the form:
https://apps.apple.com/{country-code}/app/id{app-id}
Apple's StoreKit documentation defines a storefront as a country or region context for products and purchases. We extracted every public in-app-purchase name and displayed price, then selected only exact target labels.
For labels that explicitly included “Monthly,” one unique price was required. For labels such as “ChatGPT Plus” that also appeared beside an annual-scale price, the lower price was accepted only when there were no competing low candidates and the next unique price was at least four times higher. Pages with multiple plausible low candidates were marked ambiguous.
ECB rates are quoted as currency units per euro. Conversion used:
effective USD = local sticker / local currency units per EUR × USD per EUR
premium vs US = effective USD / US same-plan sticker - 1
All comparisons use observed prices and the official ECB snapshot. Ambiguous price observations are excluded.
Study scope
- Channel: public Apple App Store pages.
- Price basis: displayed sticker converted with one ECB snapshot.
- Sensitivity: fixed local stickers recalculated with 65 daily ECB rate tables.
- Products: included monthly labels with unambiguous price resolution.
- Geography: 30 sampled storefronts, including 27 complete three-plan baskets.
- Separate comparisons: direct web, Android, tax-normalized pricing and purchasing power.
Sources
Official documentation and source records used for the figures above.
- Apple. Storefront
- Apple. Availability of Apple Media Services
- Apple. ChatGPT App Store country pages
- Apple. Claude App Store country pages
- Apple. Google Gemini App Store country pages
- Apple. Perplexity App Store country pages
- European Central Bank. Euro foreign exchange reference rates
- OpenAI. What is ChatGPT Plus?
- Anthropic. Claude pricing
- Google. Google One plans
- Perplexity. Perplexity Pro
- World Bank. GNI per capita Atlas method current US dollars
Research data
Download the citation-ready data
Cite this research
ProxyWing Research. "AI App Store Price Passport 2026: The Same Three-Plan Basket Was 42% Higher in Hungary Than in the US." August 2026. https://proxywing.com/research/ai-app-store-price-passport-2026
Frequently asked questions
Across the sampled App Store storefronts, the same three-plan basket ranged from an ECB-converted $55.21 to $85.40 across 27 complete markets.
Hungary, at an ECB-converted $85.40 per month. That was 42.4% above the US App Store basket of $59.98.
The Philippines, at an ECB-converted $55.21 per month, 8.0% below the US basket.
The comparison uses the displayed public sticker; tax inclusion remains one possible contributor to the observed gap.
Not within the tested ECB window. Holding local stickers fixed across 65 business-day rate tables kept Hungary highest every day and the high-to-low basket ratio between 1.52× and 1.60×. This is an FX sensitivity test, not a history of local App Store prices.
This release covers Apple's public App Store pages. Direct vendor websites form a separate multi-geo comparison.
When the same exact product label exposed multiple plausible low price points, the public page did not reveal enough product-ID or billing-period information to choose safely. We excluded those observations.
Proxy infrastructure for research and web workflows
Choose the ProxyWing network that fits your collection, monitoring, verification, or automation workflow.