



Traffic usage statistics are located in the card of the specific product, at the bottom of the page.
To open them:
- Open the required Standard residential proxy product.
- Scroll down to the
Traffic Usageblock.
Traffic usage
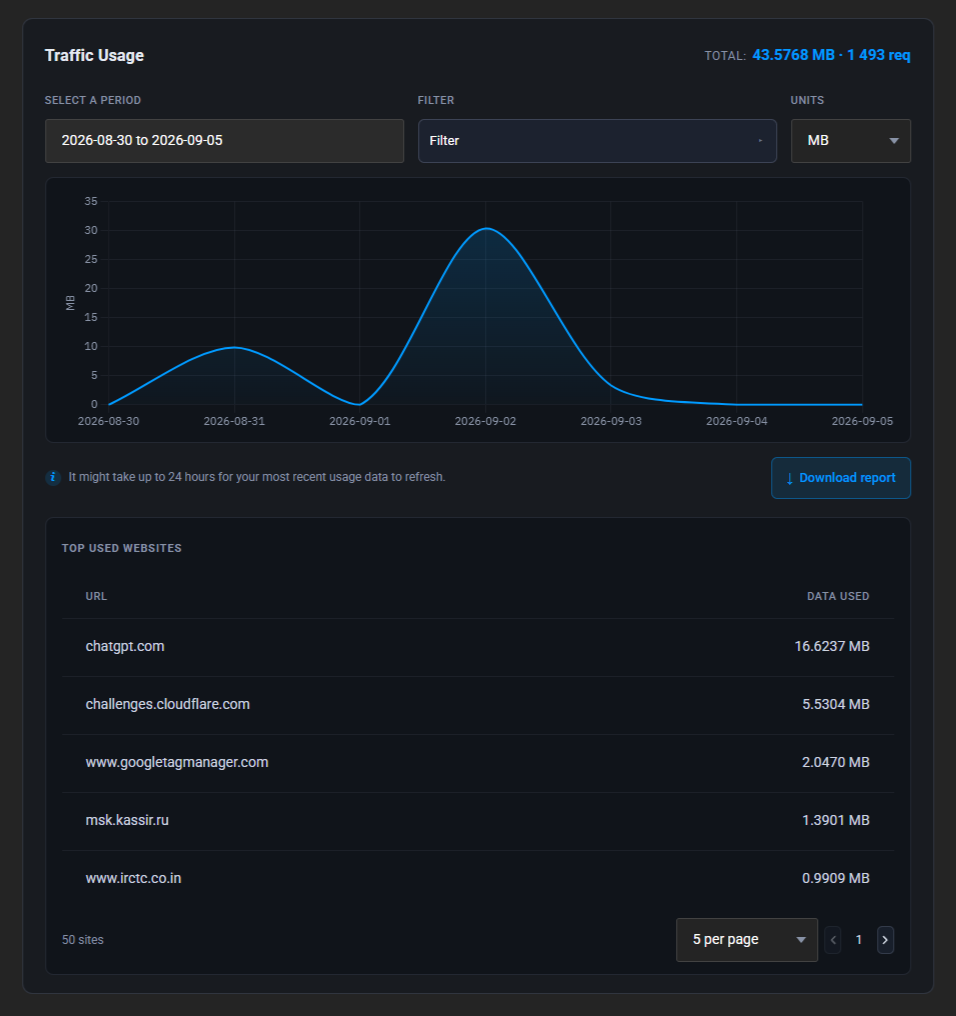
The block displays:
- Total traffic used for the selected period.
- Number of requests.
- Selected period.
- Filters.
- Units.
- Usage graph.
- Used and remaining product traffic.
The period and units can be changed directly in the product card.
Top visited sites
Below the graph, the websites where traffic was used and the amount of traffic used for each website are displayed.
Traffic usage by website can be viewed directly in the product card without downloading a separate report.
Download report
To export statistics:
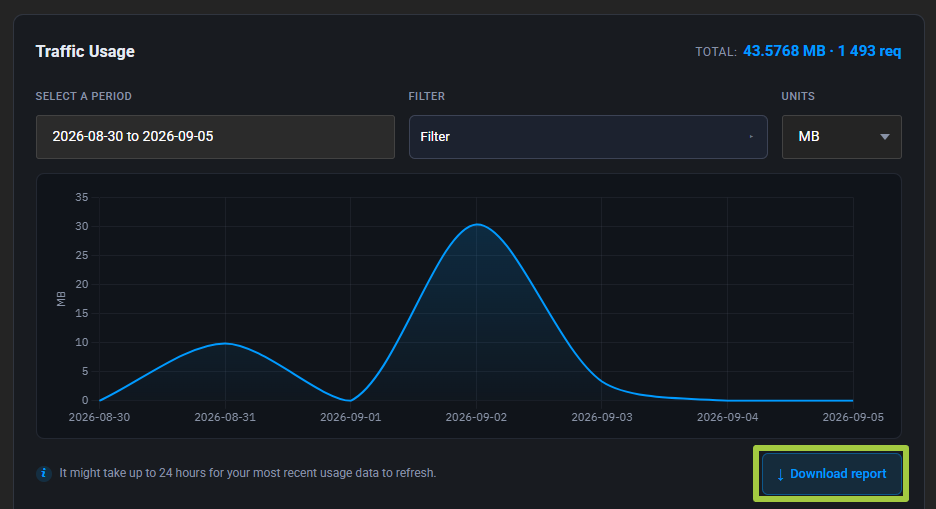
- Click
Download Report.
- Specify the period and units.
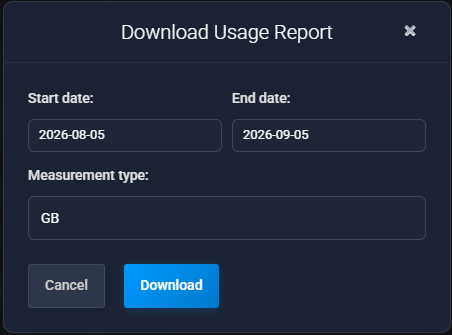
- Click
Download.
Statistics update
Usage data may be updated with a delay of up to 24 hours.
Recent requests and traffic usage may not appear in the statistics immediately.